正则化
确认训练数据
向这个函数中添加一些噪点,画成图构成为训练数据。
import numpy as np
import matplotlib.pyplot as plt

def g(x):
    return 0.1 * (x ** 3 + x ** 2 + x)

# linspace 生成 start 到 stop 的 num 个样本数 (等间距)
train_x = np.linspace(-2, 2, 8)
train_y = g(train_x) + np.random.randn(train_x.size) * 0.05

# 绘图确认
x = np.linspace(-2, 2, 100)
plt.plot(train_x, train_y, 'o')
plt.plot(x, g(x), linestyle='dashed')
plt.ylim(-1, 2)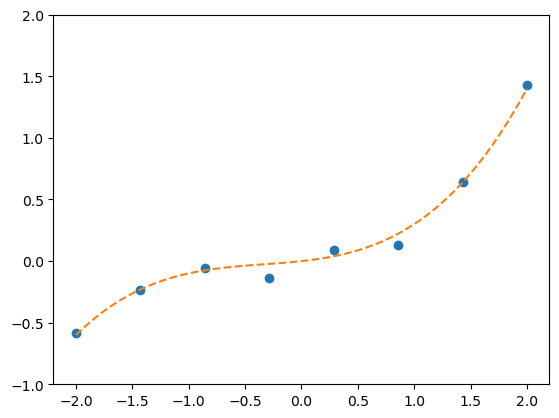
拟合为 10 次多项式
# 标准化
mu = train_x.mean()
sigma = train_x.std()


def standarize(x):
    return (x - mu) / sigma


# 训练数据的矩阵
def to_matrix(x):
    return np.vstack(
        [np.ones(x.size), x, x**2, x**3, x**4, x**5, x**6, x**7, x**8, x**9, x**10]
    ).T


train_z = standarize(train_x)
X = to_matrix(train_z)

theta = np.random.randn(X.shape[1])
# 预测函数
def f(x):
    return np.dot(x, theta)
不使用正则化
# 目标函数
def E(x, y):
    return 0.5 * np.sum((y - f(x)) ** 2)

ETA = 1e-4
diff = 1
error = E(X, train_y)
theta = np.random.randn(X.shape[1])
while diff > 1e-6:
    theta = theta - ETA * np.dot(f(X) - train_y, X)
    current_error = E(X, train_y)
    diff = error - current_error
    error = current_error

z = standarize(x)
plt.plot(train_z, train_y, 'o')
plt.plot(z, f(to_matrix(z)))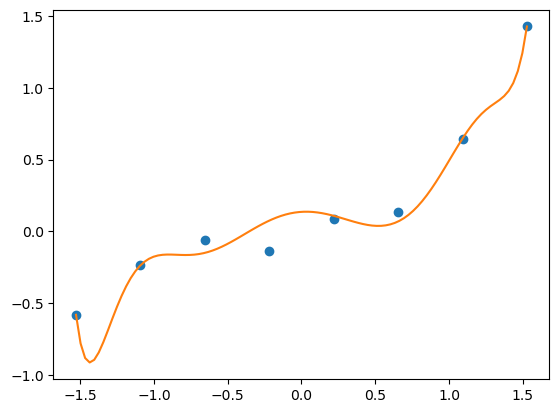
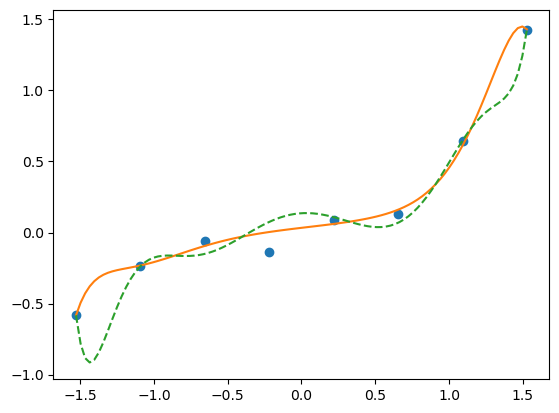
这种图像就说明函数过拟合了(每次运行的结果图像都会不一样)
使用正则化
# 保存之前的 theta 值
theta1 = theta
theta = np.random.randn(X.shape[1])

# 正则化常量
LAMBDA = 5

diff = 1

error = E(X, train_y)
while diff > 1e-6:
    # 正则化项 偏置项不用于正则化为 0
    reg_term = LAMBDA * np.hstack([0, theta[1:]])
    theta = theta - ETA * np.dot(f(X) - train_y, X + reg_term)
    current_error = E(X, train_y)
    diff = error - current_error
    error = current_error

plt.plot(train_z, train_y, "o")
plt.plot(z, f(to_matrix(z)))

theta = theta1
plt.plot(z, f(to_matrix(z)), linestyle="dashed")